Testing In Visual Studio Part 1
My Toy Project
I happened to notice that the picture of the day on Wikipedia was an animation of a maze generation algorithm (something about depth first search - see [1]). So I decided that I want to make some maze project.
I have started out making the basic element of the maze - a grid point. It represents a point in the maze with bools for north, south, east and west. It also has a method for printing it on the console. It is a pretty simple class, but it is now time to make some tests for it (the attentive reader can perhaps already locate a bug).
using System;

namespace mazer
{
    public class GridPoint
    {
        private bool east, west, north, south;

        public bool East { get { return east; } }
        public bool West { get { return west; } }
        public bool North { get { return north; } }
        public bool South { get { return south; } }

        public void OpenEast() { this.east = true; }
        public void OpenWest() { this.west = true; }
        public void OpenNorth() { this.north = true; }
        public void OpenSouth() { this.south = true; }

        public void CloseEast() { this.east = false; }
        public void CloseWest() { this.east = false; }
        public void CloseNorth() { this.north = false; }
        public void CloseSouth() { this.south = false; }

        public GridPoint(bool e = false, bool w = false, bool n = false, bool s = false)
        {
            this.east = e;
            this.west = w;
            this.north = n;
            this.south = s;
        }
    }
}
Static Code Analysis
Static code analysis can be awesome! It is a neutral way of looking at your code to discover non-compliance to coding standards and could also be a way to discover data flow anomalies and other possible problems.
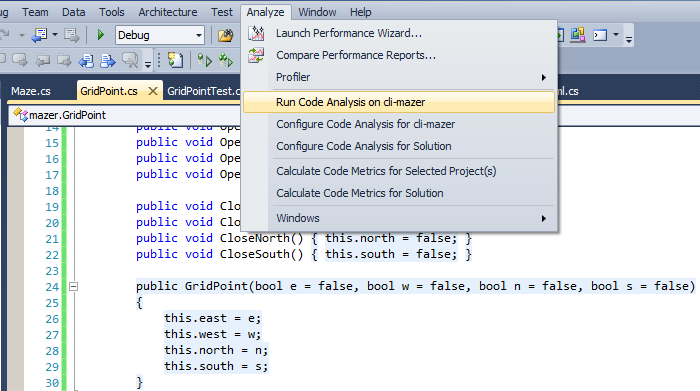
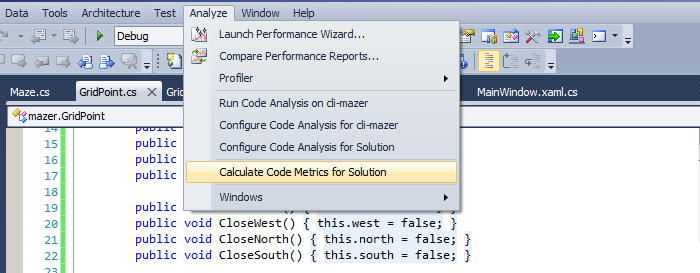
Visual Studio (at least the Ultimate version that I evaluated when writing this) has this built in. You start it from the analyze menu:
I am guessing that Visual Studio internally uses StyleCop (see [2]) and/or the compiler to generate the issues found. The list can be rather verbose and I recommend the following:
- Tweaking the settings to not get errors you wont fix.
- Regularly run the static analysis and fix all issues found: Get clean - stay clean.
The results show up where the compiler errors are typically displayed:
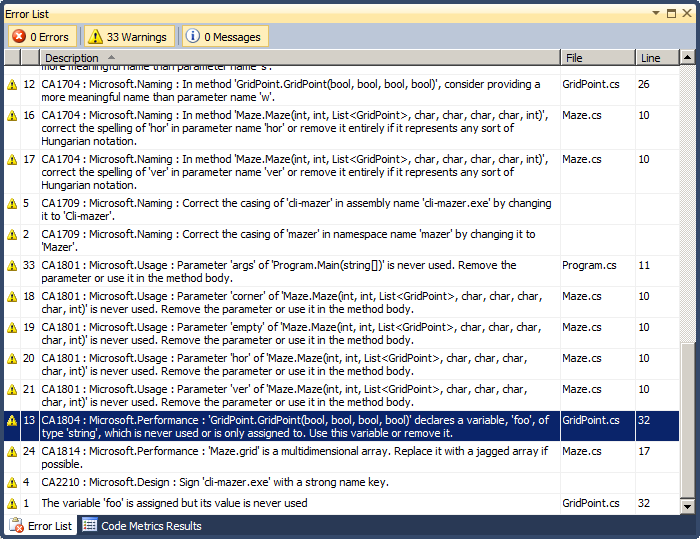
As you can see I got a lot of warnings - but I deserve them. The static analyzer lets me know that I should avoid crappy variable names: ...consider providing a more meaningful name than parameter name 'e'... which is exactly what I should do.
I added a variable foo and expected it to warn me about the unwise choice of names but it did not. On the other hand it found a typical data flow anomaly: 'GridPoint.GridPoint(bool, bool, bool, bool)' declares a variable, 'foo', of type 'string', which is never used or is only assigned to. Use this variable or remove it.
If you would like a certain warning to disappear you can add right click it in the list of errors and disable it. But I would recommend making a rule set instead - rulesets can easily be reused over projects in your organization.
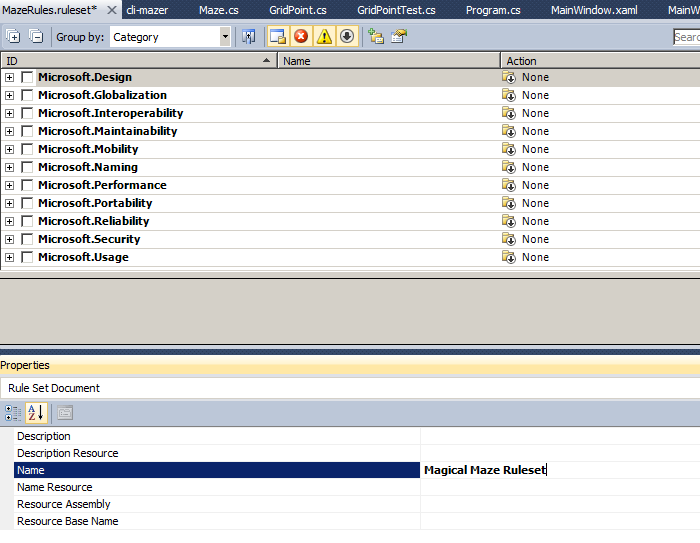
Right click on the project and select Add -> New Item. From the Installed Templates select General -> Code Analysis Rule Set.
Open the ruleset and change the name. You might also want to activate a few rules.
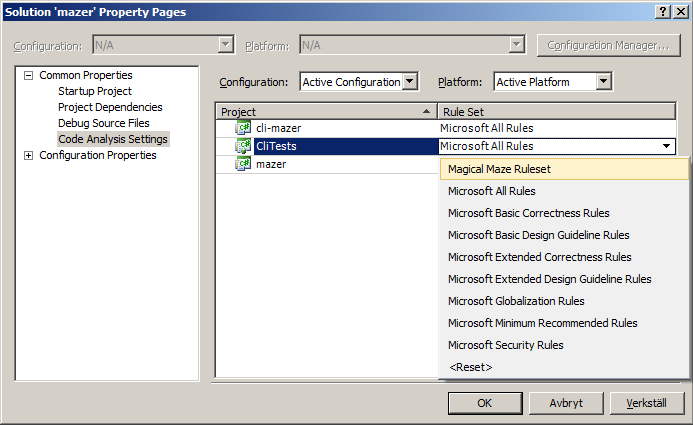
OK, so now you are ready to use your custom ruleset: In the Analyze menu you select Analyze -> Configure Code Analysis for Solution. In the dialogue that appears you can select the new ruleset:
Code Metrics
Using code metrics can be an awesome way of looking at your maintainability or complexity. But remember that some metrics are not very meaningful - like discovering that about 20% or all issues reported were implemented on a Monday :-)
The code metrics are explained by Microsoft at [3] and I quote:
- Maintainability Index ...value between 0 and 100 that represents the relative ease of maintaining the code. A high value means better maintainability... A red rating is a rating between 0 and 9 and indicates low maintainability.
- Cyclomatic Complexity Measures the structural complexity of the code... A program that has complex control flow will require more tests ... and will be less maintainable.
- Depth of Inheritance Indicates the number of class definitions that extend to the root of the class hierarchy...
- Class Coupling Measures the coupling to unique classes through parameters, local variables, return types, method calls, generic or template instantiations, base classes, interface implementations, fields defined on external types, and attribute decoration. Good software design dictates that types and methods should have high cohesion and low coupling. High coupling indicates a design that is difficult to reuse and maintain because of its many interdependencies on other types.
- Lines of Code ...approximate number of lines in the code... based on the IL... A very high count might indicate that a type or method is trying to do too much work and should be split up [and/or] might be hard to maintain.
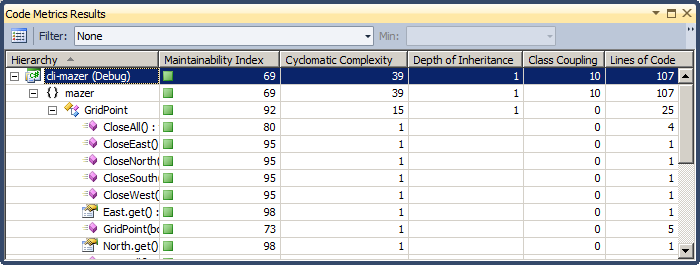
To make Visual Studio compute these values select Analyze -> Calculate Code Metrics for Solution:
As you can see this toy example has very good values.
Unit Testing
Let's look at Unit Testing in Visual Studio (you might remember Csharp Unit Test In Sharp Develop).
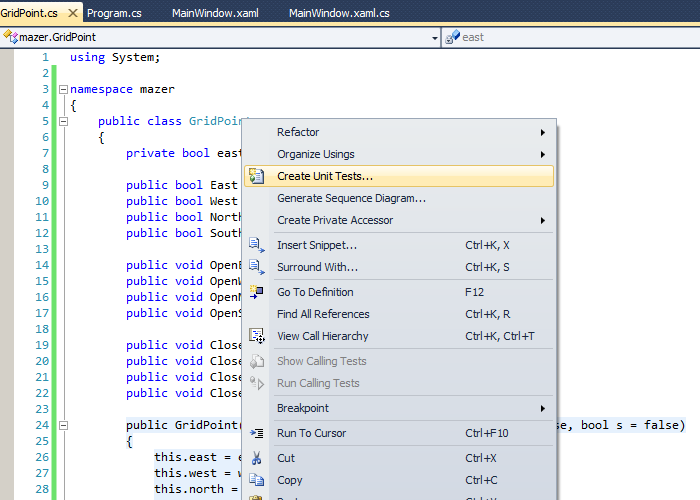
Since the class has no unit tests we can right click it and select Create Unit Tests - see the below screen shot
A dialogue appears - let's select all items:
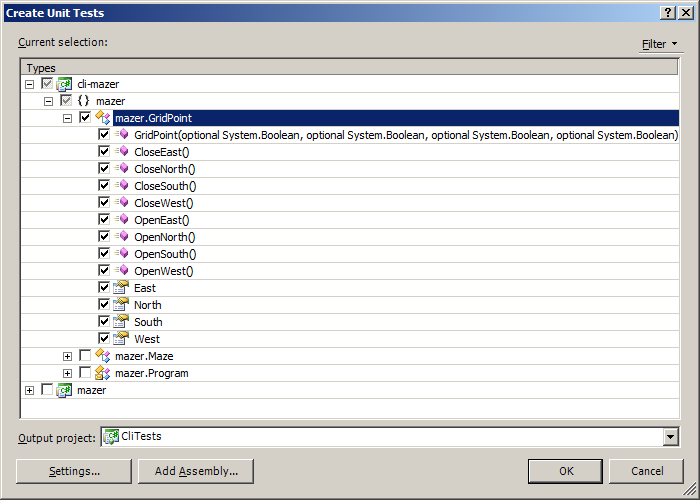
We are now presented with a new class called something like GridPointTest with methods like
        /// <summary>
        ///A test for CloseEast
        ///</summary>
        [TestMethod()]
        public void CloseEastTest()
        {
            bool e = false; // TODO: Initialize to an appropriate value
            bool w = false; // TODO: Initialize to an appropriate value
            bool n = false; // TODO: Initialize to an appropriate value
            bool s = false; // TODO: Initialize to an appropriate value
            GridPoint target = new GridPoint(e, w, n, s); // TODO: Initialize to an appropriate value
            target.CloseEast();
            Assert.Inconclusive("A method that does not return a value cannot be verified.");
        }
Let's rewrite it to something more meaningful
        [TestMethod()]
        public void CloseEastTest()
        {
            GridPoint target = new GridPoint(true, false, false, false);
            Assert.AreEqual(true, target.East, "Open before.");
            target.CloseEast();
            Assert.AreEqual(false, target.East, "Closed after.");
        }
Now, after some copy/paste programming we can run the tests and see how it goes. As you can guess there will be some problems. First due to a bug in the code of my class, but also because of tests that have not been implemented.
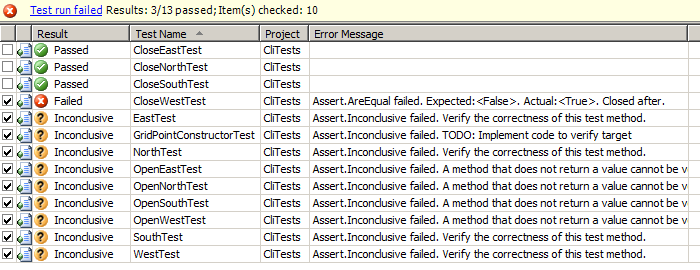
Ok, so doing some bug-fixes and a lot of Ctrl+R, K we have a scenario where all tests are passing.
Code Coverage
Now let's assume that we have added some methods while making the tests (or another developer in another time zone added some methods). Also: assume that you were (the other guy was) really sloppy while adding the code. We will not notice this unless it breaks some of the tests. So how can we notice that our tests do not cover all code? The answer is Analysing Code Coverage.
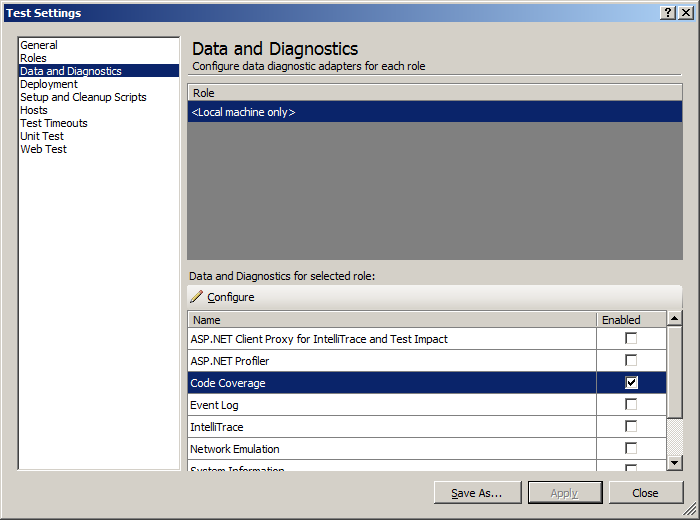
In order to take a look at code coverage we need to first activate it. In the solution explorer you should typically have a folder-like object called Solution Items. Double click Local.testsettings in that folder and select Data and Diagnostics. Then check the checkbox next to Code Coverage (like in the below image). You might also need to Configure the code coverage by pressing the configure button after checking and selecting Code Coverage. You can see the Configure button in the middle of the Test Settings window:
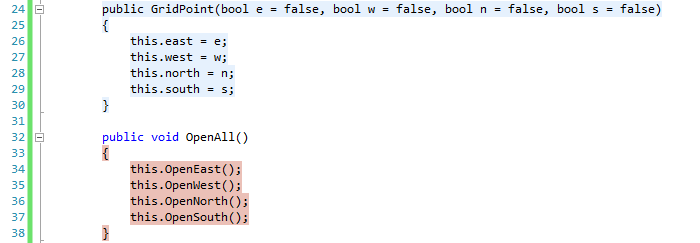
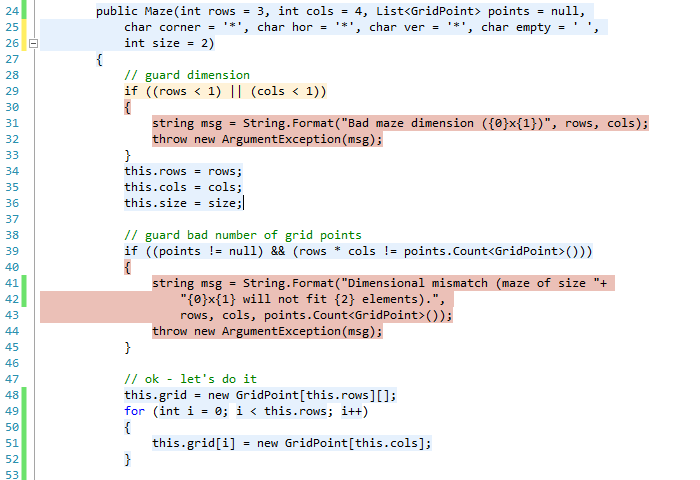
Ok, now after you run your tests you get to see what areas of your code that is not covered by looking at the background color. The covered code is blueish and the code not covered by your tests have a more pinkish tone:
Of course you get a more report-like view as well in the Code Coverage Results panel:
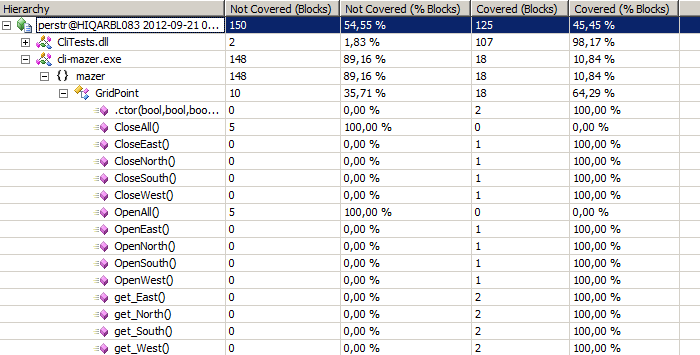
After this little analysis we can conclude that it would be a good idea to add some tests for the OpenAll and CloseAll methods - in the Microsoft point-and-click spirit we right click the method headers and select Create Unit Tests from the appearing menu.
After adding some tests for these last methods we have the interesting scenario with 144 "blocks" of code in the class GridPointTest and 28 "blocks" in the class it self - 84% of the code is test code. I am guessing this proportion will vary a lot over projects. Remember that this is a toy class with a lot of methods for manipulating bools - and that I have not followed the YAGNI - You Aint Gonna Need It principle.
Once you have (slightly) more complex code - perhaps some data flow with if-branches and some loops then it might be increasingly hard to understand which new unit tests that bring added value. Looking at the code to discover untested parts is a simple way of doing that. As I continued this toy example I discovered that I had completely forgotten testing the illegal cases.
Summary of Static Code Analysis, Unit Tests and Code Coverage in Visual Studio
So far we have covered three major areas of testing - areas that are super-simple, inexpensive and a real help for development (think Q1: Technology Facing Tests that Support the Team in Agila Testkvadranter).
- Static Code Analysis is an ultra-simple way of checking that your code follows coding guidelines, that the documentation is in place and that there are no data flow anomalies in the code. In a disciplined project you should do static code analysis on your code before every check-in. It's not always fun but it helps you evolve as a developer. When I used pylint a lot (see One Does Not Simply Document Code) I sometimes felt that pylint was out to get me. But that is of course not the case - and after a while it felt as normal as using spell-checking when typing an email. No one wants to sent an email with typos and no one should do a check-in with code that is not standards-compliant.
- Unit Testing can be an awesome tool when writing code - for example in a test-driven development project (for a primer on TDD test-driven-development at MSDN [4]). And once your units have tests the unit tests can serve as regression tests - it's a win-win situation! You never have to be scared of touching the code you wrote 6 months ago again! Writing unit tests can seem like quite an investment - especially if your API has not crystallized - but as Martin Aspeli once wrote (in [5]): Unit testing will make you more attractive to the opposite sex... Unit tests are:
- The only way of even remotely convincing your customers and friends your code doesn't completely suck.
- The only way of making sure (or at least being more confident) you don't break things without realising it.
- The only way of making sure (or at least being more confident) you don't re-introduce bugs you thought you'd fixed.
- Usually a way of saving time in the long run, because you know immediately when you break something, and you spend less time chasing down obscure bugs in code you wrote six months ago.
- A useful way of writing and testing code in the same environment - you don't have to switch context to a browser and click around to test your newest feature - just run the tests!
- Code Coverage Analysis is, again, an extremely inexpensive way or checking the quality of your tests (test the tests). If you discover that module A has 95% coverage and that the more complex module B only has 20% coverage you might want to invest your precious time in writing tests for module B. Some might argue that all code coverage below 100% is insufficient code coverage - I say it depends. A golden rule is: as long as testing is less expensive than what your save from finding the bugs early then keep testing. But if you need major investments in testing for finding only minor issues then you might not be spending your money wisely.
Belongs in Kategori Test
Belongs in Kategori Programmering
See also Testing In Visual Studio
See also Testing In Visual Studio Part 2 where we look at coded user interface tests
See also Testing In Visual Studio Part 3 where we dive deep into Continuous Build, Continuous Integration and Gated Check-in's.
See also Satstäckning Kodtäckning Eller Kodsatstäckning