Naive Plot
I made a simple console plotter in python the other day. I though I would use it to visualise simple data in the console instead of exporting to csv or using gnuplot. It turns out it was very fun to make and it really sparked my mathematical thinking. At first I gave it the name FooPlot, but I later gave it the much better name Naive Plot.
It is implemented in python and can be downloaded or forked at github: [1]
The Heart Example
Since it was recently valentines day when I first made it I wanted to plot a heart shaped curve that I saw somewhere. My Naive Plot uses parametric curves - that is two functions of the same variables deliver values for x and y. For the heart example:
from math import pi, sin, cos
from naiveplot import ParaFunc

def heartx(t):
    return 16*(sin(t)**3)

def hearty(t):
    return 13*cos(t) - 5*cos(2*t) - 2*cos(3*t) - cos(4*t)

pf = ParaFunc(heartx, hearty)

t = 1.6
p = pf(t)

print "pf(%s) = (%s, %s)" % (t, p.x, p.y)
#pf(1.6) = (15.9795416718, 3.44369720342)
So far we have created a parametric function pf and evaluated it at t = 1.6. The answer was a point. Now we want to plot it for values of t between -pi and pi with increments of 0.001:
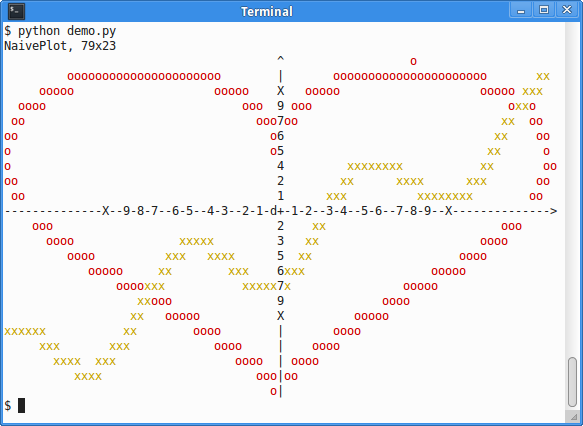
# continued from above
from naiveplot import Curve, NaivePlot

c = Curve(pf, -pi, pi, 0.001)

heart = NaivePlot()
heart.add_curve(c, 'o')
heart.fit_curve(c)

print heart
The output will be something like:
                                       ^                  o
         oooooooooooooooooooooo        |       oooooooooooooooooooooo
     ooooo                    ooooo    X   ooooo                    ooooo
  oooo                            ooo  9 ooo                            oooo
 oo                                 ooo7oo                                 oo
oo                                    o6                                    oo
o                                     o5                                     o
o                                      4                                     oo
oo                                     2                                    oo
 oo                                    1                                   oo
--------------X--9-8-7--6-5--4-3--2-1-d+-1-2--3-4--5-6--7-8-9--X-------------->
    ooo                                2                               ooo
      oooo                             3                            oooo
         oooo                          5                         oooo
            ooooo                      6                     ooooo
                ooooo                  7                 ooooo
                    oooo               9              oooo
                       ooooo           X          ooooo
                           oooo        |       oooo
                              oooo     |    oooo
                                 oooo  | oooo
                                    ooo|oo
                                      o|
Just add Colors
I added support for colors with the colorama and termcolor libraries that are available by pip-install. The reason for using a 3'rd party library is their built-in support for windows consoles (I have not verified it on windows).
The difference is that when curves are added to the curve the name of a color is also used:
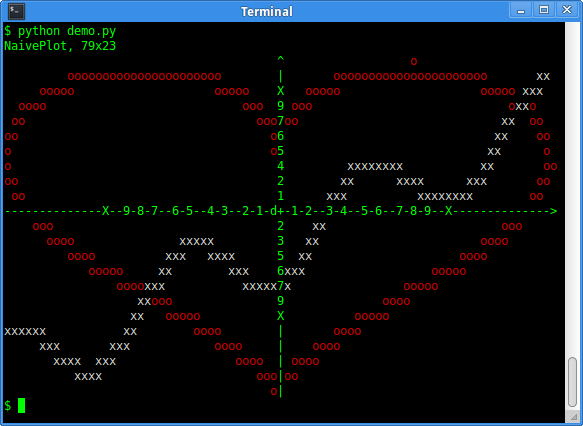
# heart.add_curve(c, 'o')
heart.add_curve(c, 'o', 'red')
A screen shot from gnome-terminal:
It also looks good with the typical green on black color scheme:
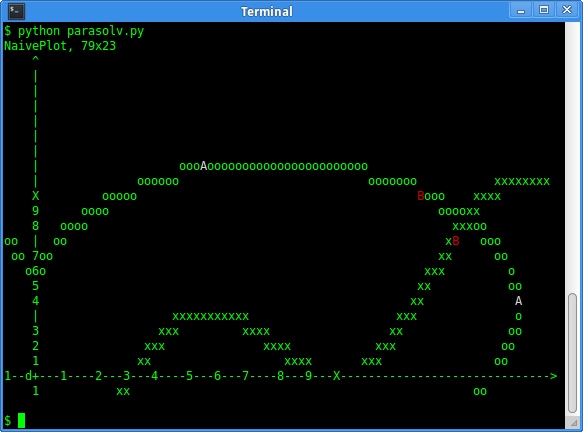
Finding the intersection of two parametric functions
The next task was to find the intersection of two parametric functions - it really has nothing to do with Naive Plot. But it is what I continued with. This part is far from completed but my draft can be investigated at github: [2]
Initial Approach
First I wanted to iterate by halving the interval of s and t somehow, take some starting values (white A) and iterate one step (to red B):
Second Approach
But then I thought I needed a way to know if the curves don't intersect - so I thought of a way of limiting the curve with rectangles. First a big rectangle per curve. If the rectangles overlap the we divide and keep looking. If the rectangles that contain one curve do not overlap with the rectangles of the other curve, then we know that there is no overlap. Otherwise we can keep going until we have a small enough rectangle for our precision. This image, from a notebook illustrates when two curves do not overlap.

See also Naive Plot Stdin
Tillhör Kategori Programmering
Tillhör Kategori Plot