Per Erik Strandberg /cv /kurser /blog

I made a simple way of plotting data with a naiveplot, for example if it comes on standard in, or if it is stored in a file.

http://www.pererikstrandberg.se/blog/naiveplot-stdin.png

My first implementation was to read lines from standard in and get an integer and plot it. This was really efficient and compact

#!/usr/bin/python

from sys import stdin
from naiveplot import Naive Plot, Point, Line, Curve

ctr = 1
plot = Naive Plot(xmin=-0.1, ymin=-0.1)
points = list()
old = None

for line in stdin:
    y = int(line.strip())
    p = Point(ctr, y)
    points.append(p)
    ctr += 1

    if old:
        l = Line(old, p)
        plot.add_curve(Curve(l, 0.0, 1.0, 0.02), '.', 'blue')
    old = p

for p in points:
    plot.add_curve(p, '*', 'blue')
    plot.fit_curve(p)

print plot

But I wanted something slightly smarter and started a better implementation that takes some arguments and so on. Here is a short demo of it in action:

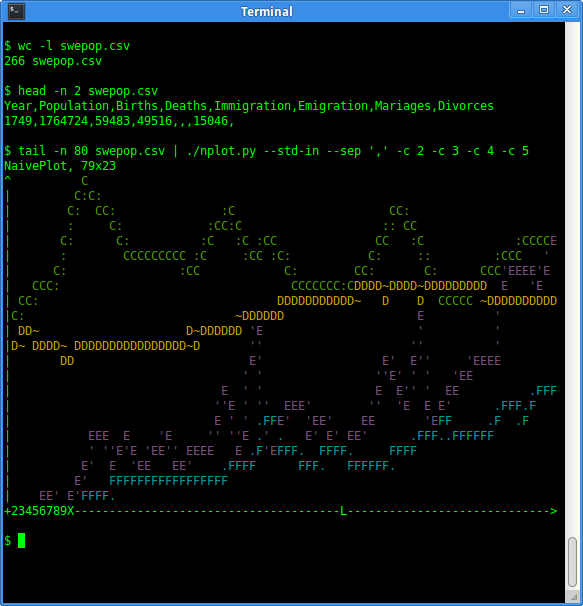
$ wc -l swepop.csv
266 swepop.csv

$ head -n 2 swepop.csv
Year,Population,Births,Deaths,Immigration,Emigration,Mariages,Divorces
1749,1764724,59483,49516,,,15046,

$ tail -n 80 swepop.csv | ./nplot.py --std-in --sep ',' -c 2 -c 3 -c 4 -c 5 

Source is available at github: [1]

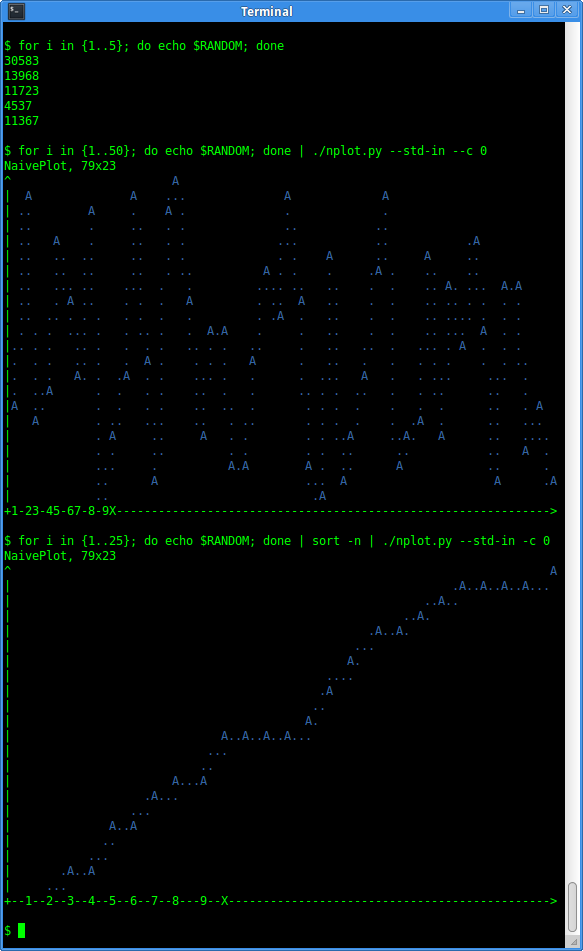
Another use case is when some script ejects random number you want to investigate:

$ for i in {1..5}; do echo $RANDOM; done
30583
13968
11723
4537
11367

$ for i in {1..50}; do echo $RANDOM; done | ./nplot.py --std-in --c 0NaivePlot, 79x23
^                       A                                                      
|  A              A    ...              A             A                        
| ..        A     .    A .              .             .                        
| ..        .     ..   . .              ..           ..                        
| ..   A    .     ..   . .             ...           ..           .A           
| ..   ..  ..     ..   . .             . .    A      ..     A     ..           
| ..   ..  ..     ..   . ..          A . .    .     .A .    ..    ..           
| ..   ... ..    ...  .   .         .... ..   ..    .  .    .. A. ...  A.A     
| ..   . A ..    . .  .   A         . ..  A   ..    .  .    .. .. . .  . .     
| ..  .. . . .   . .  .   .         . .A  .   ..    .  .    .. .... .  . .     
| . . .  ... .   . .. .   .  A.A    .     .   ..    .  .    .. ...  A  . .     
|.. . .   .. .   .  . .   .. . .   ..     .   ..   ..  .   ... . A  .  . .     
|.  . .   .. .   .  A .    . . .   A      .   ..   .   .   . . .    .  . ..    
|.  . .   A. .  .A  . .    ... .   .      .  ...   A   .   . ...     ...  .    
|.  ..A      .  .   . .    ..  .   .      .. . .  ..   .   . ..      ..   .    
|A  ..       .  .   . .    ..  ..  .       . . .  .    .   .  .      ..   . A  
|   A        . ..   ...    ..   . ..       . . .  .    .  .A  .      ..   ...  
|            . A     ..     A   . .        . . ..A     ..A.   A      ..   .... 
|            . .     ..         . .        . .  ..      ..           ..   A  . 
|            ...     .          A.A        A .  ..      A            ..      . 
|            ..      A                     ...  A                     A      .A
|            ..                             .A                                 
+1-23-45-67-8-9X-------------------------------------------------------------->

$ for i in {1..25}; do echo $RANDOM; done | sort -n | ./nplot.py --std-in -c 0
Naive Plot, 79x23
^                                                                             A
|                                                               .A..A..A..A... 
|                                                           ..A..              
|                                                        ..A.                  
|                                                   .A..A.                     
|                                                 ...                          
|                                                A.                            
|                                             ....                             
|                                            .A                                
|                                           ..                                 
|                                          A.                                  
|                              A..A..A..A...                                   
|                            ...                                               
|                           ..                                                 
|                       A...A                                                  
|                   .A...                                                      
|                 ...                                                          
|              A..A                                                            
|             ..                                                               
|           ...                                                                
|       .A..A                                                                  
|     ...                                                                      
+--1--2--3--4--5--6--7--8---9--X---------------------------------------------->


http://www.pererikstrandberg.se/blog/naiveplot-random.png


See also Naive Plot

Belongs in Kategori Plot
Belongs in Kategori Programmering