Python Pandas First Look
I did the typical sudo apt-get install python-pandas to install pandas -- there are probably a million other ways of doing it.
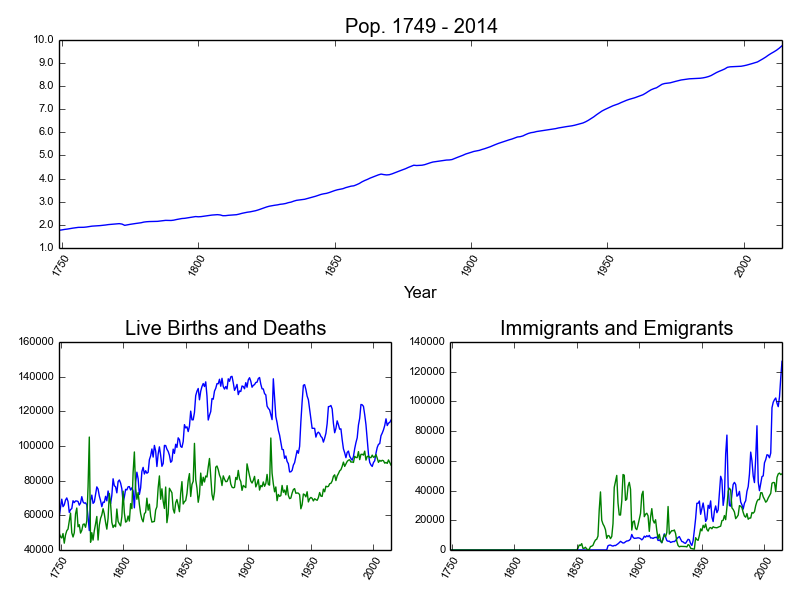
First of all I wanted to remake a similar plot as in Python And Matplotlib with some shortcuts in pandas. This was simplified with the logfile and shell expansions. This illustrates the principles:
$ ipython --logfile=/tmp/`date +'%Y%m%d-%H%M%S'`-ipython-log.py
[...]

In [1]: import pandas

In [2]: !ls *.csv
1749-2014-swepop.csv

In [3]: data = pandas.read_csv('1749-2014-swepop.csv')

[...]
In this very non-beautiful example I use what pandas refer to as a dataframe, for example in data['Year'].min().
import pandas
import matplotlib.pyplot as plt

from matplotlib.artist import setp
from matplotlib.ticker import FuncFormatter

# this could be also be a date formatter for example
def million_formatter(value, position):
    """I want f.x. 1500000 to be represented as 1.5"""
    return "%1.1f" % (int(value) * 1e-6)

formatter = FuncFormatter(million_formatter)

data = pandas.read_csv('1749-2014-swepop.csv')

# 2x2 grid -- fill top row
ax = plt.subplot2grid((2, 2), (0, 0), colspan=2)
ax.yaxis.set_major_formatter(formatter)
ax.set_xlim(data['Year'].min(), data['Year'].max())

ax.plot(data['Year'], data['Population'])
ax.set_xlabel('Year')
ax.set_xlim(data['Year'].min(), data['Year'].max())
plt.title('Pop. %s - %s' % (data['Year'].min(), data['Year'].max()))
labels = ax.get_xticklabels()
setp(labels, rotation=60, fontsize=8)
labels = ax.get_yticklabels()
setp(labels, fontsize=8)


#second subplot consumes one space
ax = plt.subplot2grid((2, 2), (1, 0))
ax.plot(data['Year'], data['Live Births'])
ax.plot(data['Year'], data['Deaths'])
ax.set_title('Live Births and Deaths')
ax.set_xlim(data['Year'].min(), data['Year'].max())
labels = ax.get_xticklabels()
setp(labels, rotation=60, fontsize=8)
labels = ax.get_yticklabels()
setp(labels, fontsize=8)

#third subplot consumes one space
ax = plt.subplot2grid((2, 2), (1, 1))
ax.plot(data['Year'], data['Immigrants'].replace('..', 0).fillna(0))
ax.plot(data['Year'], data['Emigrants'].replace('..', 0).fillna(0))
ax.set_title('Immigrants and Emigrants')
ax.set_xlim(data['Year'].min(), data['Year'].max())
labels = ax.get_xticklabels()
setp(labels, rotation=60, fontsize=8)
labels = ax.get_yticklabels()
setp(labels, fontsize=8)

plt.tight_layout()
plt.savefig('swedenpop.png')
This page belongs in Kategori Programmering
See also Data Analysis With Python
See also Ipython First Look